
Mode: Quickstart - Getting Started with Mode
This series of hands-on exercises is perfect for learning how to get started with Mode quickly. Great for analysts and data-savvy business users alike.
Mode: Exercise 1: From SQL Query to Simple Report
After completing this exercise you will have an understanding of how to navigate the Mode interface to go from SQL query to a simple report.
FREE
Show Overview
Mode: Exercise 2: Simple Visual Explorer Chart and Custom Colors
After completing this exercise you will have an understanding of how to use Mode's Visual Explorer to create simple visualizations.
FREE
Show Overview

Mode: Exercise 3: Using Table Calculations and Calculated Fields
After completing this exercise you will have an understanding of how to create calculated fields in Mode and apply custom conditional formatting.
FREE
Show Overview
Mode: Exercise 4: Creating Hypotheses Through Visual Analytics
After completing this exercise you will have an understanding of how to use Mode's visualization environment to create hypotheses and gain deeper insights.
FREE
Show Overview
Mode: Exercise 5: Predictive Analytics Using Python
After completing this exercise you will have an understanding of how to use Mode's integrating notebook to perform Python-based analytics.
FREE
Show Overview
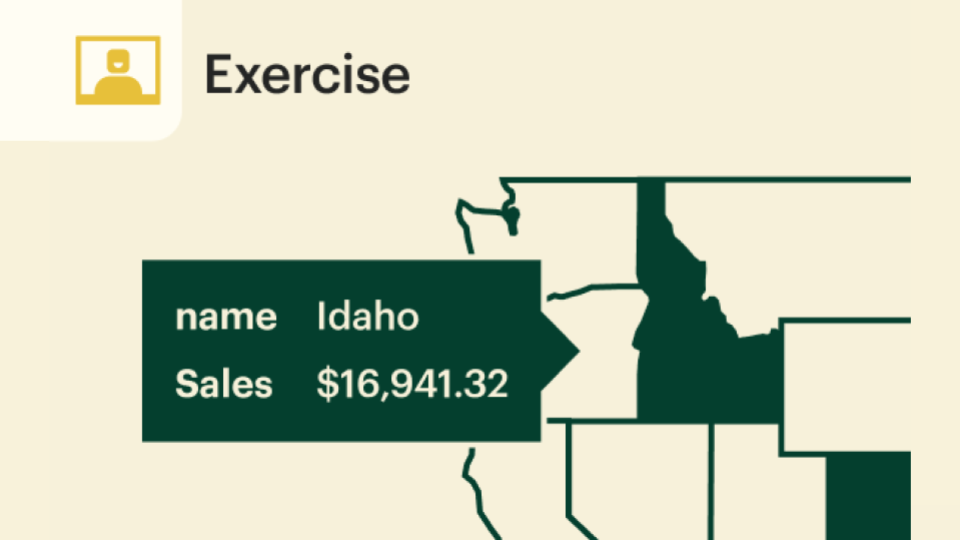
Mode: Exercise 6: Geo Mapping (Option 1 - Python)
After completing this exercise you will have an understanding of how to use libraries in Python to create visualizations to complement Mode's native capabilities.
FREE
Show Overview

Mode: Exercise 7: Geo Mapping (Option 2 - JavaScript)
After completing this exercise you will have an understanding of how to use Mode's HTML editor and how to use JavaScript to complement Mode's native visualizations.
FREE
Show Overview

Mode: Exercise 8: Adding a Report Parameter and Creating a Gauge Visualization
After completing this exercise you will have an understanding of how to add parameters to a report.
FREE
Show Overview
Mode: Exercise 9: Adding Filters, Text and Formatting a Report
After completing this exercise you will have an understanding of how to apply Report filters, add text and format a Report.
FREE
Show Overview
Mode: Exercise 10: Creating & Using a Dataset
After completing this exercise you will have an understanding of how to create a new Dataset in Mode, and how to use a Dataset for a no-code report creation process.
FREE
Show Overview